
The most popular DeFi advice is also the least reliable: find the highest APY, deposit, and let the yield compound. That approach treats a changing market rate as if it were a guaranteed product. In reality, DeFi interest rates are moving signals, and the number on a dashboard can reflect utilization, temporary incentives, liquidity risk, smart contract exposure, and execution conditions.
Stablecoin lending makes the problem especially clear. In 2026, major stablecoin supply yields often sit in the low-single-digit range, with some markets moving higher when liquidity tightens, according to stablecoin market data from AaveScan. Those returns can be close to, or below, short-dated Treasury alternatives after risk and operational costs are considered. The important question is no longer, “Which protocol pays the most?” It's, “What drives this rate, how durable is it, and what do I keep after risk?”
Why DeFi Interest Rates Are No Longer the Easy Win They Used to Be
Many readers still carry a 2021 mental model of DeFi. Stablecoins appeared to offer unusually generous lending yields, and long-tail assets sometimes displayed even larger numbers. That environment encouraged a simple habit: sort markets by APY and choose the highest visible result.
The market has matured. By October 2021, weighted average borrowing rates were 2.85% on Aave and 1.43% on Compound, while weighted average lending rates were 7.50% and 4.45%, respectively, as documented in comparative historical DeFi rate data. Those figures also show why the screen can mislead. The rate paid by a borrower and the return received by a supplier aren't the same number, because utilization, reserve factors, and protocol mechanics determine how the spread is distributed.
In early January 2022, stablecoin borrowing rates across major platforms such as Aave and Compound were near 5%, even though the U.S. federal funds rate was still 0%, according to historical DeFi market data. By 19 March 2024, Banque de France analysis noted that DeFi borrowing rates had remained meaningfully above traditional policy rates for a prolonged period. The contrast demonstrates that on-chain money markets can move with crypto-native supply and demand instead of following central-bank benchmarks closely.
The 2026 comparison
Recent market snapshots place major stablecoin supply rates in the low-to-mid single digits under normal conditions. AaveScan reports an Aave USDC supply APR around 3.28% and borrow APR around 4.5%, while broader stablecoin summaries commonly place USDC and USDT supply APY in the 3% to 7% range. The same tracker notes that borrowing can move into the 5% to 8% APR band or higher when liquidity becomes scarce. See the AaveScan stablecoin rate tracker for the current market context.
Instrument | Typical 2026 APY | Notes |
|---|---|---|
Major stablecoin lending markets | Low to mid single digits | Variable and utilization-driven |
Short-dated Treasury alternatives | Benchmark for comparison | Compare after fees, access, and risk |
Incentive-heavy or thin markets | Can be materially higher | Higher headline yield may signal higher risk |
A separate analysis found that “safe” stablecoin supply rates average around 3%, while Aave's 30-day average yield on USDC and USDT is around 2%. It also reported that 58% of more than $20 billion in stablecoin vault TVL across Ethereum and Layer 2 networks earns under 3% APY, as discussed in The Defiant's analysis of on-chain yield. That comparison changes the task. The skill is reading utilization, dispersion, and execution quality, not collecting the largest number on a ranking page.
What DeFi Interest Rates Actually Are
A DeFi interest rate is the return or borrowing cost produced by a smart contract's rules and the market activity around that contract. A bank can set a deposit rate through internal pricing decisions, funding needs, and policy conditions. A lending pool usually updates its rate from observable on-chain variables, especially how much capital borrowers are using.

A simple way to understand the difference is to compare two accounts:
Bank deposit account: The institution accepts your cash, lends or invests it, and chooses the rate it pays you. Its pricing may respond to policy rates, competition, and balance-sheet objectives.
DeFi lending pool: A smart contract accepts an asset, records deposits, allows approved borrowing against collateral, and calculates rates using a public formula.
On-chain position: You interact with the contract directly through a wallet. The rate belongs to the specific asset and market, rather than to a general relationship with a financial institution.
The displayed rate is usually annualized, but the contract accrues interest continuously through blockchain state changes. The exact update behavior depends on the protocol and chain. A USDC market on Aave, a USDC market on Compound, and a curated vault that routes into either venue can all show different rates for what appears to be the same dollar exposure.
What the rate doesn't mean
The percentage on the interface isn't a promise that you'll receive that return for a full year. It's a current estimate based on the market's present conditions. If borrowers repay, new lenders arrive, or liquidity leaves, the rate can change.
Practical rule: Treat a displayed APY as a live quote, not a fixed deposit agreement.
The contract's formula, collateral rules, liquidation process, reserve treatment, and governance settings all matter. A high rate may indicate strong borrower demand, scarce liquidity, temporary token rewards, or a market that carries risks the headline number doesn't show.
How Protocols Set the Rate Behind the Scenes
The core variable in many lending protocols is utilization. It measures how much of the supplied liquidity borrowers are using:
Utilization = borrowed amount ÷ supplied amount
When utilization is low, the pool has ample available liquidity. The protocol has less reason to offer lenders a higher return or charge borrowers a high cost. As utilization rises, available liquidity becomes harder to access, so the protocol raises both the borrow rate and, indirectly, the supply rate.
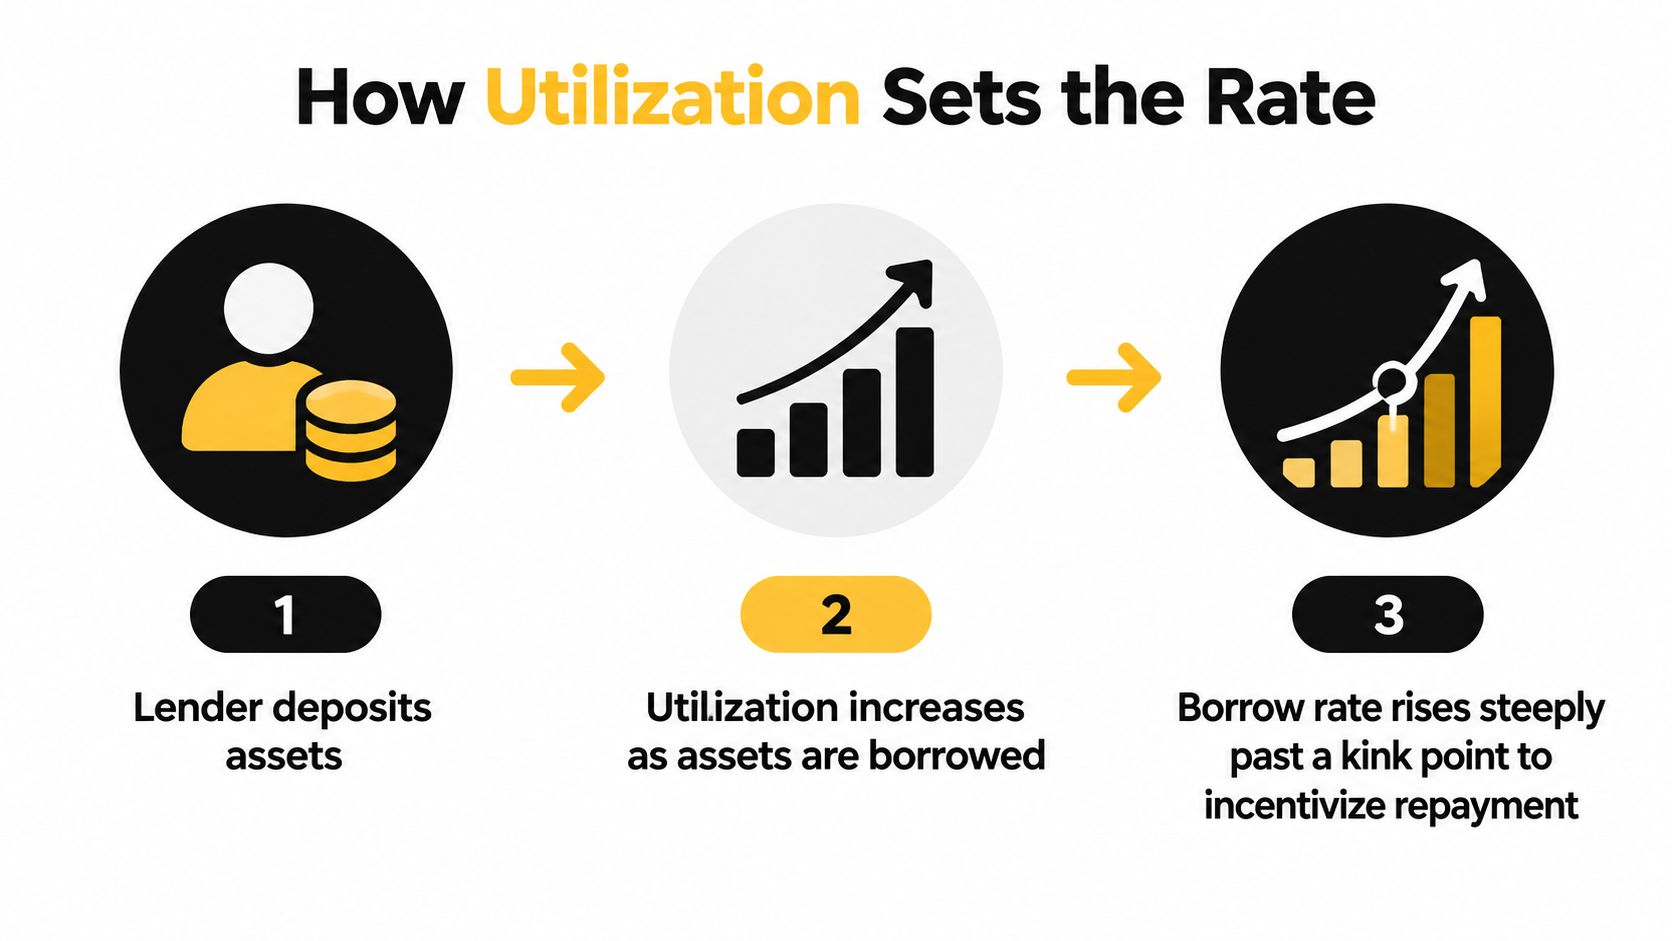
The utilization curve
A typical variable-rate model has a gradual section followed by a kink point. Before the kink, the borrow rate rises as utilization increases, but the change is relatively controlled. Past the kink, the curve becomes much steeper. That steep increase encourages borrowers to repay or add collateral and encourages suppliers to bring more liquidity into the pool.
The Banque de France and ECB describe DeFi lending rates as automatic functions of utilization. Their analysis also notes that Aave's USDC rate model rises as utilization rises, which is explained in the Banque de France study of DeFi lending mechanics.
The supply rate doesn't equal the borrow rate because the pool earns interest only on the portion that borrowers use. A simplified relationship looks like this:
Supply rate ≈ borrow rate × utilization × protocol allocation factor
The allocation factor represents the portion retained for reserves or other protocol purposes. The actual implementation varies by protocol and market.
Different engines, different inputs
Aave and Compound primarily use utilization-based models. Morpho markets can expose more granular parameters because market creators or curators define specific loan configurations. Some variable-rate products also use oracle inputs from systems such as Chainlink or Pyth to reference external data, but an oracle feed doesn't automatically turn a DeFi rate into a fixed benchmark. It supplies information to a model whose final behavior still depends on the product's design.
For a deeper explanation of lending-market architecture, see this guide to lending protocols. The important operational point is that the function is public, while the future inputs aren't known. A dashboard shows the result of the model now. It can't guarantee the result after your transaction settles.
APR vs APY and Why Compounding Changes the Math
APR is a simple annualized rate. It describes the annual rate before compounding. APY includes the effect of reinvesting earned interest, so it can be higher than APR even when both labels refer to the same underlying return.
Suppose a protocol quotes a 5% APR. If it compounds once per year, the effective annual return remains 5%. If it compounds daily, each day's interest becomes part of the balance used to calculate the next day's interest, producing an APY of roughly 5.13%. The difference is not a bonus created by the protocol. It's the mathematical result of earning interest on previously earned interest.
The general relationship is:
APY = (1 + APR ÷ compounding periods) ^ compounding periods − 1
In DeFi, the compounding interval may be per block, continuous in the accounting model, or applied when you manually reinvest. Rewards paid in a separate token introduce another layer. A dashboard may display the base lending rate as APR and add estimated token incentives as APY, even though the reward token's market value can change.
Compounding Frequency | Effective APY | Extra Yield vs APR |
|---|---|---|
Annual | 5.00% | 0.00 percentage points |
Monthly | Approximately 5.12% | Approximately 0.12 percentage points |
Daily | Approximately 5.13% | Approximately 0.13 percentage points |
Continuous | Approximately 5.13% | Approximately 0.13 percentage points |
These examples use a 5% APR and illustrate compounding math, not a guaranteed protocol return. Always check whether the interface compounds automatically, whether gas costs apply to manual reinvestment, and whether rewards are included in the quoted figure.
Read the label before comparing markets
A variable 5% APR and a promotional 5% APY aren't directly comparable. Neither is a lending rate versus a staking rate, because staking may include issuance rewards, validator economics, or slashing exposure. Readers comparing broader staking opportunities may find this overview of high APY staking useful, provided they separate staking rewards from lending interest.
The distinction between a quoted rate and a realized return is also central to yield versus rate. Your actual result can differ because the rate changes, rewards fluctuate, the position sits idle during a rebalance, or transaction costs reduce reinvestment.
Where the Rate Comes From Across Markets
A displayed APY has meaning only when you know the engine producing it. Three common DeFi structures can show similar percentages while exposing you to completely different sources of return.
Lending markets
In Aave, Compound, and many Morpho markets, borrowers create the demand that funds supplier returns. The utilization curve raises the borrowing cost as available liquidity becomes scarce. Suppliers earn a portion of that borrower-paid interest, adjusted by utilization and the protocol's reserve parameters.
A stablecoin lender in this model is taking exposure to the lending market's smart contracts, collateral and liquidation design, oracle system, governance, and liquidity conditions. The return is primarily a payment for supplying capital to borrowers, not a trading fee.
Automated market makers
A Uniswap v3 or Curve liquidity provider earns from swaps that pass through the pool. The result depends on trading volume, selected fee tier, liquidity depth, incentive programs, and the behavior of the paired assets. A pool can advertise an attractive recent return because activity was high, but that doesn't mean the same activity will continue.
AMM liquidity also introduces price-range and inventory risks. A provider may earn fees while ending with a different asset mix than the one deposited. For stablecoin pools, depeg risk and pool imbalance deserve special attention.
Curated vaults and aggregators
Yearn, Convex, and similar systems inherit their base return from underlying strategies. A vault may lend, provide liquidity, stake governance assets, claim incentives, and reinvest rewards. Auto-compounding can improve convenience, but it doesn't remove the risks of the underlying contracts or the vault's own accounting and withdrawal process.
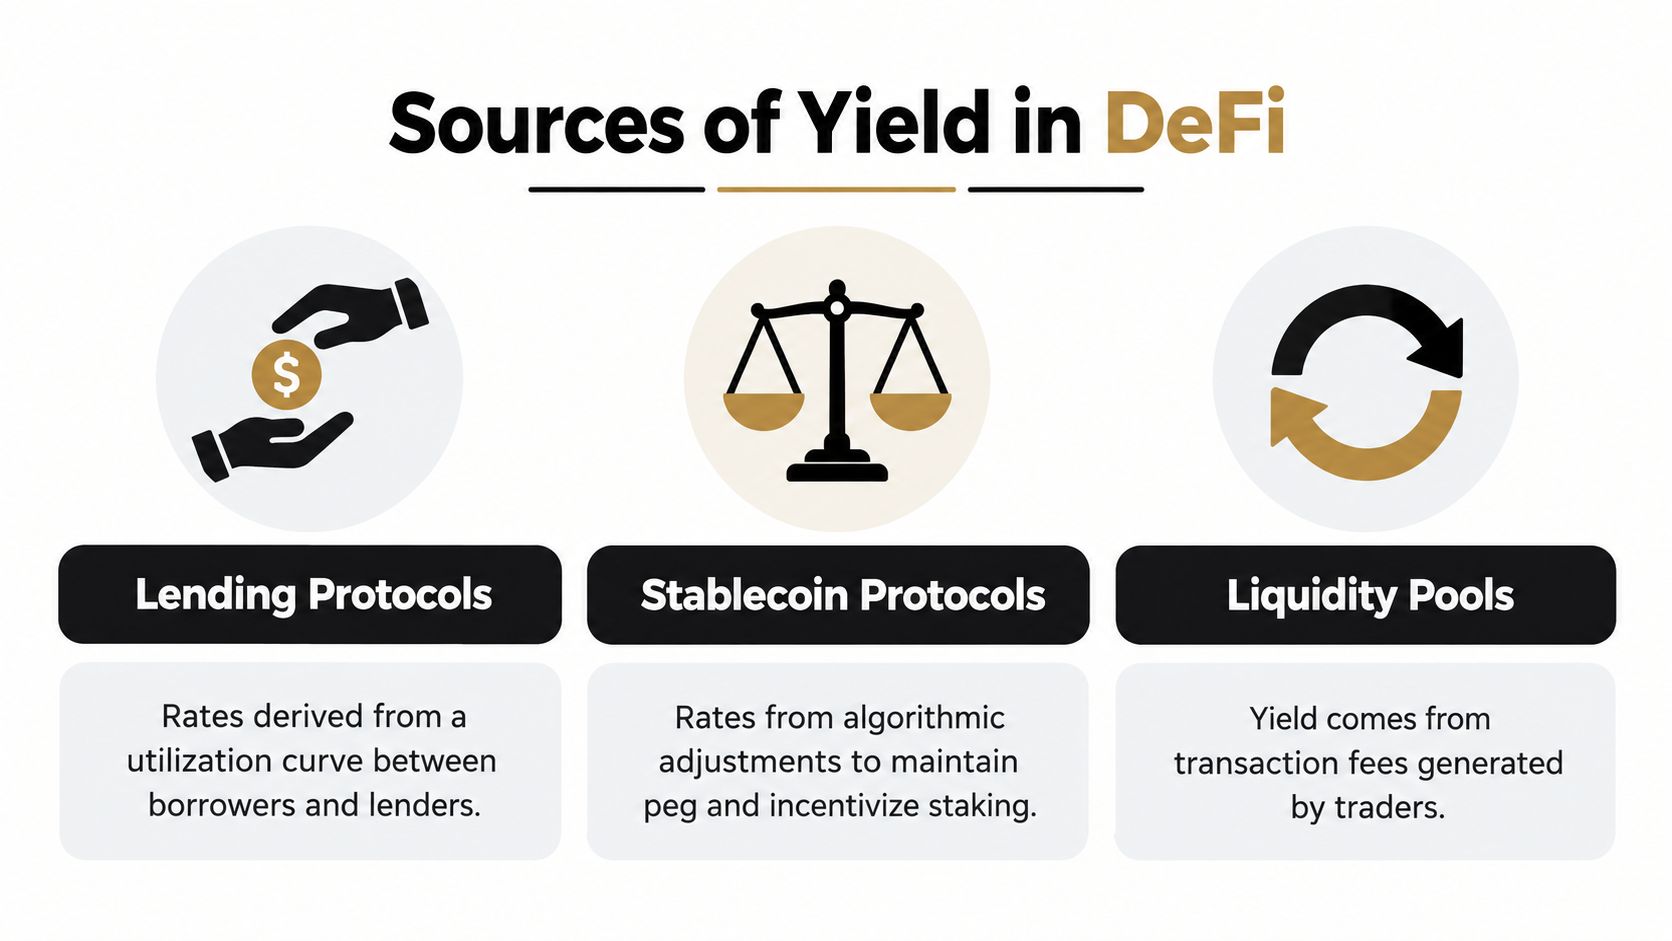
The same nominal APY can therefore represent borrower demand, swap activity, token emissions, or a layered strategy. Before comparing numbers, identify the cash-flow source. A lender should ask whether the return comes from real borrowing, trading fees, new token issuance, or a combination.
A high rate isn't a category. It's the output of a specific mechanism with specific failure modes.
Reading Rates Like a Risk Analyst, Not a Headline Hunter
A risk-adjusted return starts with the quoted rate and removes the costs and exposures required to earn it. That sounds obvious, but many comparisons stop at the APY field.
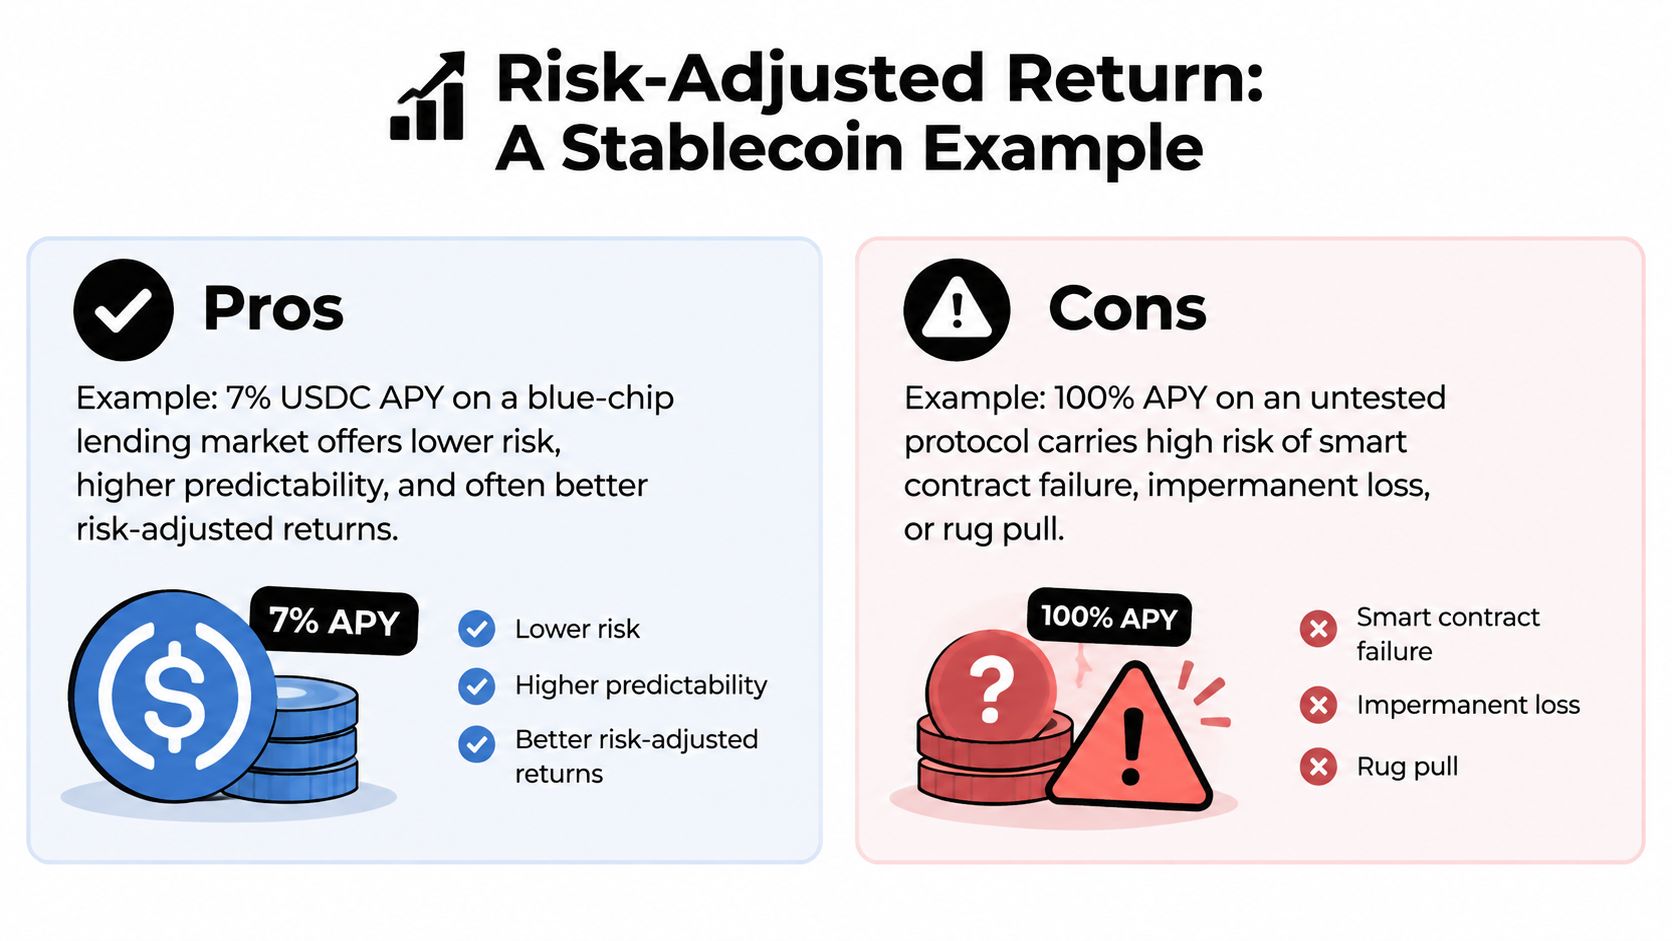
Consider two hypothetical USDC markets, one offering 7% on a well-established lending protocol and another offering 12% on a thin, lightly tested venue. The second number is higher, but the comparison isn't complete. Smart contract risk, oracle failure, liquidity depth, governance concentration, and stablecoin depeg exposure can make the additional return inadequate compensation.
The assigned infographic uses a sharper illustration, contrasting 7% USDC APY on a blue-chip lending market with 100% APY on an untested protocol. Those figures are examples of risk framing, not current market quotations.
The benchmark most comparisons skip
Stablecoin yield should be compared with a suitable cash benchmark, not only with another crypto product. Recent reporting found that the blended stablecoin lending rate ended June 30 below the four-week U.S. Treasury bill yield by 37.1 basis points, while noting that DeFi borrowing rates had converged with the Federal Reserve policy rate. That finding appears in The Defiant's real-yield analysis.
The practical calculation is:
Risk-adjusted DeFi return = quoted yield − direct costs − expected risk costs − operational friction
Direct costs can include transaction fees, vault fees, and insurance costs. Reward claims may lose value through market impact or MEV. A treasury manager hedging stablecoin depeg exposure may also incur an implicit funding cost.
A usable decision test
Before depositing, write down:
Contract exposure: Which contracts hold the assets, and how much code sits between you and withdrawal?
Liquidity exposure: Can you exit without moving the market or accepting a large discount?
Oracle exposure: What data does the protocol use, and what happens if that data becomes stale?
Reward quality: Is the return paid by borrowers and traders, or mostly by token emissions?
Benchmark spread: Does the residual return justify the additional complexity over a Treasury or insured cash alternative?
A rate can be attractive without being competitive after these deductions. The relevant figure is what remains after you price the risks you're taking. For a framework focused on this distinction, see risk-adjusted APY analysis.
Monitoring and Comparing Rates Without Chasing Noise
A rate dashboard is a starting point, not a decision engine. The number can change as borrowers enter, lenders withdraw, incentives expire, or a market approaches its utilization kink. A screenshot from yesterday may describe a market that no longer exists in practical terms.
Start with a broad aggregator view, then narrow the search:
Filter by asset. Compare USDC with USDT separately. Don't combine assets just because both aim to track the dollar.
Filter by market type. Separate lending APR from AMM fee returns, staking rewards, and vault APY.
Inspect utilization. A high supply rate paired with very high utilization may be vulnerable to a rapid rate change or limited withdrawals.
Separate base yield from incentives. Identify the reward token, vesting or claim process, liquidity, and sustainability.
Check the borrow side. A supply rate makes more sense when you understand why borrowers are paying it and how much demand supports it.
Review execution depth. A large deposit can change the rate in a thin pool or create price impact in an AMM.
Track realized results
Record the quoted APR or APY, deposit size, transaction costs, reward receipts, and withdrawal result. This lets you compare advertised yield with realized yield rather than relying on a ranking page. If you maintain an internal dashboard, the workflow is similar to methods used to track changes on protected sites: record snapshots, identify meaningful changes, and investigate the cause rather than reacting to every fluctuation.
Execution speed matters, but rushing creates its own errors. Split a large allocation when one venue can't absorb it efficiently, use a router only when its fees and contract exposure are clear, and verify the final transaction parameters before signing.
Weekly review: Confirm the rate source, utilization, incentive composition, oracle status, liquidity, and your realized return.
Yield Seeker offers an AI-powered stablecoin yield agent that monitors DeFi protocols and allocates capital across available strategies, with users able to view balances and earnings and retain access to their funds. Visit Yield Seeker to evaluate whether an automated, risk-aware monitoring workflow fits your stablecoin strategy.