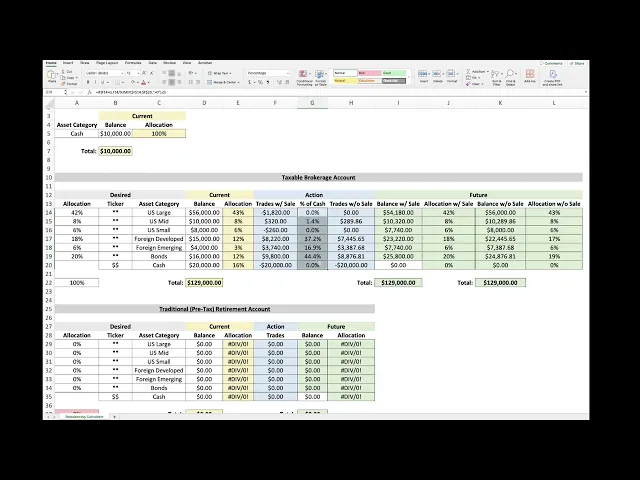

You open your portfolio dashboard and notice that your carefully chosen allocation no longer looks familiar. You started with 60% ETH, 30% BTC, and 10% in a stablecoin yield position, but a strong BTC run has shifted the mix to 47% ETH, 38% BTC, and 15% stablecoin yield. Nothing feels urgently broken, yet the portfolio now carries a different set of risks from the one you originally approved.
The portfolio is worth $120,000 in this example. The question isn't whether BTC has performed well. It's whether the new allocation still matches your risk plan, tax position, cash needs, and willingness to trade. A portfolio rebalancing calculator turns that uneasy dashboard check into an auditable decision by comparing target weights, current values, drift bands, available cash, and trading constraints.
A Relatable Moment Before You Reach for a Calculator
At the original allocation, the $120,000 portfolio would hold $72,000 in ETH, $36,000 in BTC, and $12,000 in the stablecoin yield position. After the drift, the balances are $56,400, $45,600, and $18,000 respectively. BTC is above target, ETH is below target, and the stablecoin position has become larger than planned.
The first temptation is to sell enough BTC to restore the original percentages immediately. The second is to ignore the change because the portfolio is still diversified. Both reactions skip the decision that matters most: what level of drift is acceptable under your plan?
Practical rule: A calculator should support a decision you can explain later, not replace the decision itself.
Drift often feels manageable when viewed as a percentage on a dashboard. It can become more consequential when repeated market moves, deposits, withdrawals, and yield accrual push the portfolio further from its intended risk budget. In an on-chain strategy, the same issue can appear when one token appreciates, a liquidity position changes value, or stablecoin income accumulates in a separate wallet. Traditional accounts have their own complications, including taxable sales, fractional shares, and cash sitting outside the allocation model.
A useful workflow begins with the same $120,000 example and asks three questions:
What inputs does the calculator need?
How does it convert those inputs into trades?
Which method fits the portfolio, calendar, cash flows, taxes, and constraints?
The output may recommend selling BTC, buying ETH, holding the stablecoin position, or redirecting new contributions instead of selling anything. It may also tell you that an exact rebalance isn't feasible under the rules you entered. That last result isn't a failure. It may be the most honest answer the tool can provide.
Why Portfolio Rebalancing Exists in the First Place
Rebalancing preserves a chosen risk structure. A target allocation is a policy for distributing exposure across assets with different price behavior, liquidity, income characteristics, and downside risks. It also sets a risk budget, the amount of portfolio dependence you are willing to assign to each exposure.
Price movements can change that structure without a single trade. A volatile crypto asset may appreciate quickly and become a much larger share of the portfolio, while a stablecoin yield position may grow more gradually through accrued income. Their drift comes from different sources, yet both can move the portfolio away from its intended design. Rebalancing brings an overweight position down and directs capital toward an underweight position.

Risk control comes before return optimization
Diversification can reduce exposure to risks specific to one asset, protocol, issuer, or company. The portfolio still carries broad market risk, and rebalancing does not remove it. Its job is to stop a successful position from consuming more of the risk budget than your plan allows.
That distinction matters in crypto portfolios. BTC and ETH may both be liquid and widely held, but they can still move together during stressed markets. A stablecoin yield position may follow a different return path, while introducing protocol, smart contract, counterparty, depeg, and liquidity risks. A calculator measures allocation drift. You still need to decide whether those underlying risks justify the assigned targets.
Drift rules translate intent into action
A calculator needs a rule for deciding when a difference is large enough to justify a trade. A commonly used 5/25 approach draws attention when an asset moves about 5 percentage points from its target, or when its relative deviation reaches about 25% of the target weight, as described in the rebalancing drift calculator guidance.
This heuristic should be adapted to the portfolio. A 5 percentage point change has a different effect on a small target than on a large one. Calendar reviews may suit predictable contributions and taxable accounts, threshold rules may suit volatile assets, and contribution redirection can reduce selling when new cash is available. Taxes, withdrawals, transaction costs, and liquidity limits can make an exact trade list impractical, so a useful calculator should expose those constraints rather than assume they do not exist.
Inputs Every Portfolio Rebalancing Calculator Asks For
A basic calculator can compare current and target weights. A more advanced one goes further by asking what you're allowed to trade, what cash is arriving, and what selling may cost. The quality of the result depends on the quality of those inputs.
Required fields
Start with the current value of every asset. Enter ETH, BTC, stablecoins, cash, stocks, bonds, funds, and any other position that belongs in the portfolio. If a stablecoin position earns yield through a protocol, decide whether the calculator should treat the position as one stablecoin allocation or separate the underlying token from the strategy exposure.
Next, enter the target allocation for each asset. Most tools expect percentages or weights that add up to the full portfolio. A common mistake is entering dollar targets into a percentage field, or leaving cash and stablecoins out because they aren't viewed as “investments.” Excluding them changes every other weight.
The total portfolio value should be calculated from the same snapshot as the individual holdings. If prices come from different times, the weights may not reconcile. Check whether the tool includes accrued yield, pending orders, uninvested brokerage cash, and wallet balances.
Recommended settings
A drift threshold tells the calculator whether to recommend action now or only flag the position for review. You may use an absolute band, such as a percentage-point difference, or a relative band based on the target weight.
Transaction costs make the trade list more realistic. Include commissions where applicable, network fees for on-chain transactions, spreads, gas, and any platform charges you expect to incur. Also specify which assets are tradable. A token held in a locked position, an unavailable fund, or a fractional holding may make an otherwise tidy trade impossible.
Optional fields that change the answer
Tax-aware output requires more detail. Add cost basis, acquisition dates or holding-period classifications, account type, and the lots you're willing to sell. Without those fields, the calculator may show a mathematically correct sale that creates an undesirable taxable event.
Cash-flow fields are equally important. Enter available cash, planned deposits, withdrawals, and contribution timing. A tool can then direct new money toward the underweight asset before selling an appreciated holding.
Finally, set a minimum trade size. This prevents tiny purchases, dust balances, and operationally inefficient orders.
Input | Category | Purpose in the calculator |
|---|---|---|
Current value per asset | Required | Measures each holding's present weight |
Target allocation | Required | Defines the desired portfolio mix |
Total portfolio value | Required | Provides the denominator for weight calculations |
Drift threshold | Recommended | Determines when the tool signals action |
Trading costs | Recommended | Adjusts the proposed trades for execution friction |
Tradable asset list | Recommended | Removes positions that can't be traded |
Cost basis and holding period | Optional | Supports tax-aware sale and lot analysis |
Available cash and planned flows | Optional | Enables contribution redirection and withdrawal planning |
Minimum trade size | Optional | Filters out impractical small orders |
For a broader view of the data sources and features that help investors monitor positions, see best crypto portfolio trackers. The main lesson is simple: tax-aware and cash-flow-aware outputs only appear when the relevant fields are supplied.
Formulas Behind the Numbers and How to Read the Output
A calculator generally follows a short sequence. It measures the current portfolio, compares each position with its target, calculates the post-trade value, and then produces buys and sells that should reconcile across the entire portfolio.
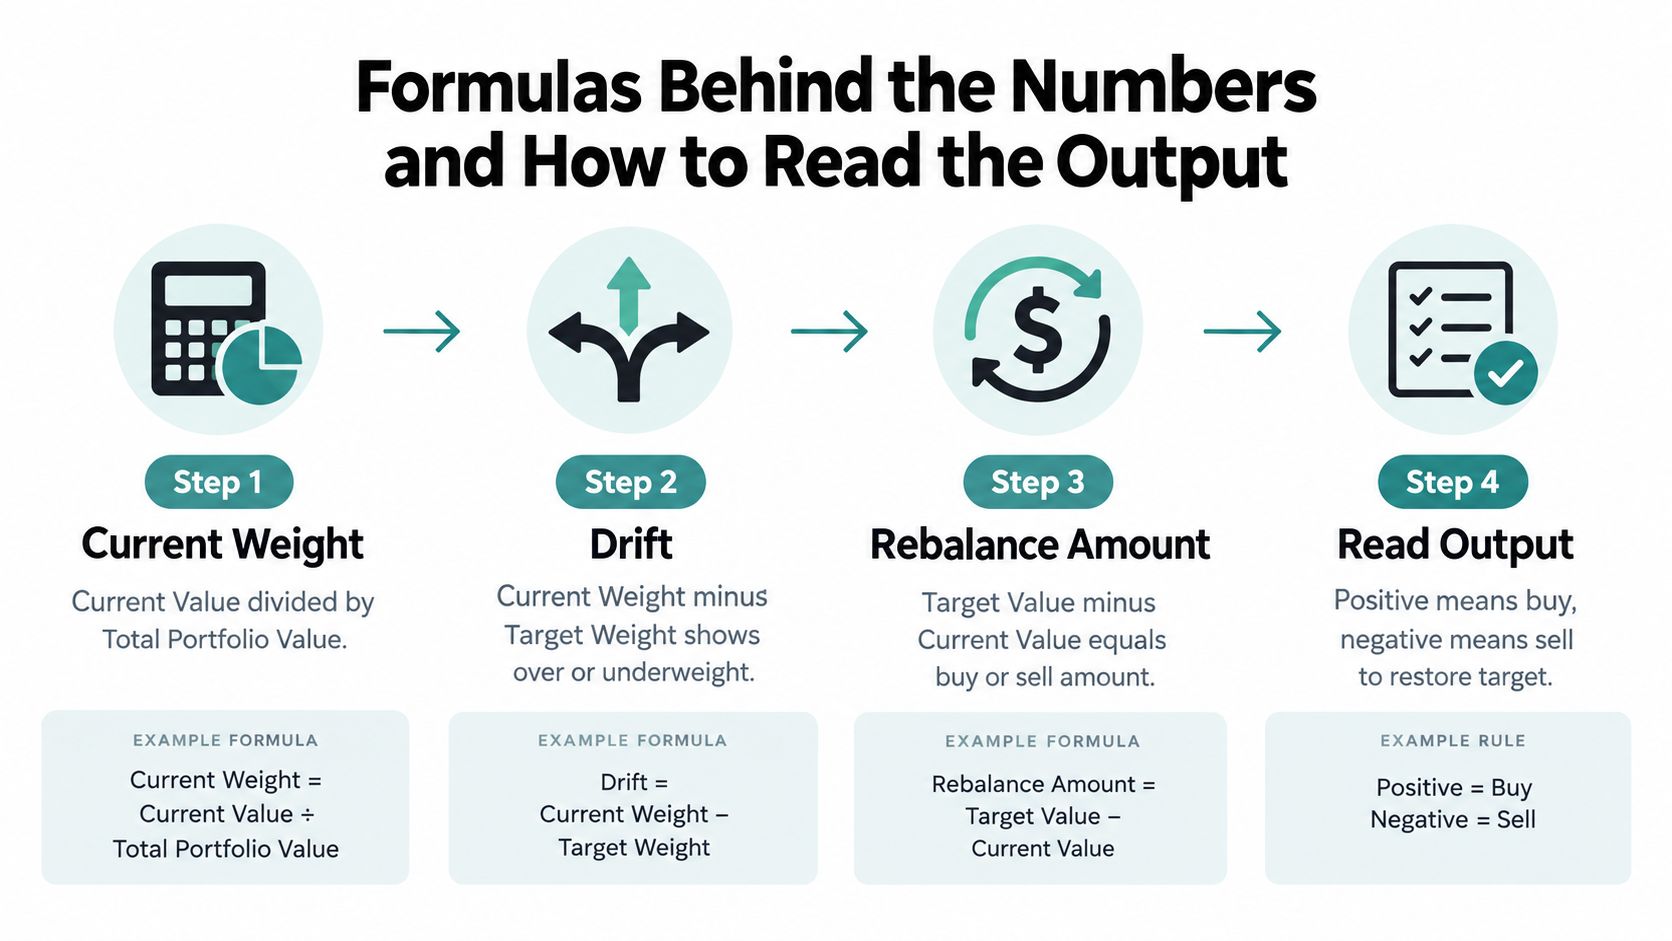
Step one measures current weight
For each asset:
Current weight = current asset value ÷ total portfolio value
In the $120,000 example, BTC is worth $45,600. Its current weight is therefore $45,600 divided by $120,000, or 38%. If the target is 30%, the drift is:
Drift = current weight minus target weight
BTC has a drift of plus 8 percentage points. ETH, at 47% against a 60% target, has a drift of minus 13 percentage points. The stablecoin yield position, at 15% against a 10% target, has a drift of plus 5 percentage points.
A relative deviation can also be useful:
Relative deviation = drift ÷ target weight
For BTC, the 8 percentage point drift is measured against its 30% target. This helps compare positions with different target sizes, but the calculator should show whether it uses absolute or relative thresholds.
Step two derives target values and trades
If the post-trade portfolio value is known, the target value is:
Target value = target weight × post-trade portfolio value
The proposed trade is:
Trade amount = target value minus current value
A positive result means buy. A negative result means sell. If you use $120,000 as the post-trade value, ETH's target value is $72,000. Since the current ETH value is $56,400, the calculator identifies a $15,600 purchase before fees and other adjustments. BTC's target value is $36,000, so it identifies a $9,600 sale. The stablecoin position's target value is $12,000, creating a $6,000 sale.
Those figures don't necessarily describe the final order list. A calculator that works well solves all assets together, including cash, planned deposits, withdrawals, fees, and rounding. Using the current total independently for every asset can produce a target that fails to fund the buys or leaves the final weights inconsistent.
For more background on return calculations and the difference between portfolio values and performance measures, review how to calculate investment returns.
Step three validates execution
Treat the output as a proposed trade plan, not an automatic order. Confirm that:
Funding works: The largest purchase can be funded by sales, available cash, or a planned contribution.
Holdings are sufficient: A negative trade doesn't exceed the asset you own.
Fees are included: Final weights are checked after commissions, spreads, network fees, and other costs.
Rounding is practical: Share quantities, token decimals, minimum orders, and dust rules are respected.
Taxes are visible: Estimated gains, holding periods, lot selection, and after-tax drift are shown where supported.
A tax-aware tool may recommend a smaller sale, a different lot, or contribution redirection. That output can be less exact before tax but more useful after tax.
Choosing the Right Rebalancing Method for Your Portfolio
No single schedule suits every portfolio. A long-term investor making regular deposits faces different decisions from a DeFi participant whose positions change as rewards accrue. Choose a method by weighing risk control, taxes, trading costs, cash flows, responsiveness, and the effort required to monitor it.
Calendar-based review
A calendar method checks allocations on fixed dates, such as monthly, quarterly, or annual reviews. On each date, open the calculator, update holdings, and compare the proposed trades with your investment policy.
The appeal is consistency. Scheduled reviews are easy to remember and document, and they can align with salary contributions or treasury inflows. The limitation is timing: the review may create trades even when drift is minor, or leave a large deviation unaddressed after a market move.
Threshold-based action
A threshold method trades only when an allocation leaves its permitted band. The widely used 5/25 guideline considers rebalancing when an asset is more than 5 percentage points from its target or more than 25% of its relative target weight, as summarized by portfolio rebalancing guidance.
The band turns risk deviation into an action rule. Tighter bands respond sooner, but may increase turnover, tax exposure, and transaction costs. Wider bands reduce intervention while accepting more drift. Set them according to liquidity, tax status, and risk tolerance. For automated workflows, automated portfolio rebalancing options can help enforce the selected rules, but review whether the system handles staking rewards, gas costs, minimum order sizes, and unavailable liquidity.
Contribution and withdrawal redirection
New cash can often restore part of the allocation without selling. Direct contributions toward an underweight asset, or route planned withdrawals from an overweight position when the account structure permits. This can reduce realized gains, although the portfolio may return to target gradually.
Taxes and cash flows should change the recommendation. In a taxable account, compare the tax cost of selling appreciated lots with the risk of leaving the allocation outside its band. In an on-chain strategy, include deposits, reward accrual, withdrawals, swap fees, and gas before deciding whether a small trade is practical. If contributions cannot close the gap, the calculator should show the remaining drift rather than imply that the target is achievable.
Method | Trigger | Main advantage | Main trade-off |
|---|---|---|---|
Calendar | Scheduled review date | Easy to remember and document | Can trade despite minor drift |
Threshold | Allocation leaves a permitted band | Links action to risk deviation | Requires monitoring and band design |
Contribution redirection | New cash or planned withdrawal | Can reduce sales and tax realization | May restore targets gradually |
Frequency alone does not guarantee better returns. Research summarized by automated portfolio rebalancing discussion reports that, for a 50/50 stock-bond mix over 1968 to 1991, annual, quarterly, and monthly rebalancing returned 9.02%, 9.12%, and 9.16%, a spread of only 0.14 percentage points. The same source describes an annual case with an 8.34% return and a 0.49% rebalancing bonus, while a separate 16-year all-weather backtest reported 7.81% for buy-and-hold versus 6.70% for annual rebalancing.
Use the calculator to compare each method with your taxes, cash flows, liquidity, and risk limits. The best rule is the one you can follow and execute without forcing infeasible trades.
Worked Scenarios You Can Recreate in Any Calculator
Worked examples expose errors that a polished dashboard can hide. Use the same sequence every time: enter holdings, calculate weights, measure drift, create target values, propose trades, and validate the final portfolio.
Scenario one with two stablecoin positions
Suppose a $10,000 portfolio has a 60% target for one stablecoin position and a 40% target for another. The current values are $7,200 and $2,800. Current weights are therefore 72% and 28%.
The first position has plus 12 percentage points of drift, while the second has minus 12 percentage points. The target values are $6,000 and $4,000, so the calculator proposes a negative $1,200 trade for the overweight position and a positive $1,200 trade for the underweight position.
The signs matter. Negative means sell, positive means buy. Since the total sale funds the total purchase, the result is straightforward, assuming both positions are liquid and the calculator's minimum-order and fee rules don't interfere.
Scenario two with a crypto contribution and cash buffer
Now return to the $120,000 ETH, BTC, and stablecoin yield example. Instead of selling the entire amount required to restore targets, suppose you plan to deposit $2,000 and keep a separate cash buffer. The calculator should add the deposit to the post-contribution portfolio value before calculating target values.
That new capital can be directed toward ETH, the underweight asset, reducing the amount of BTC that needs to be sold. The final trade list depends on how much of the deposit is assigned to ETH, whether the stablecoin position remains capped, and whether fees are paid from the portfolio or separately.
A practical output may still be unable to reach exact targets. Network fees, token minimums, slippage, unavailable liquidity, or a rule against selling a particular position can create residual drift. Enter those constraints before trusting the result, then check the final weights after the proposed orders and fees.
Scenario three with taxable holdings and new contributions
Consider a portfolio containing stocks, bonds, and a taxable account. You plan to contribute $1,500 and want the new money to go toward the underweight asset. A tax-blind calculator may recommend selling an appreciated stock position and buying bonds immediately. A tax-aware calculator can instead compare the contribution, available cash, cost basis, holding period, and selected tax lots.
The resulting plan may direct the $1,500 contribution toward bonds, sell only a smaller amount of the appreciated holding, or choose a lot with a more manageable gain. Estimated taxes can alter the economically sensible target, even when the stated allocation remains unchanged.
In every scenario, validate four outputs:
Weights: Recalculate each final holding as a share of the final portfolio.
Drift: Compare each final weight with its target and threshold.
Funding: Confirm that buys are covered by sales, cash, or contributions.
Constraints: Check fees, lot rules, minimum orders, and available holdings.
If the calculator returns a negative trade quantity where no short selling is allowed, or asks for more cash than exists, it hasn't found a valid execution plan. Treat that as a constraint warning, not as an order.
When Not to Rebalance and How to Read Infeasible Outputs
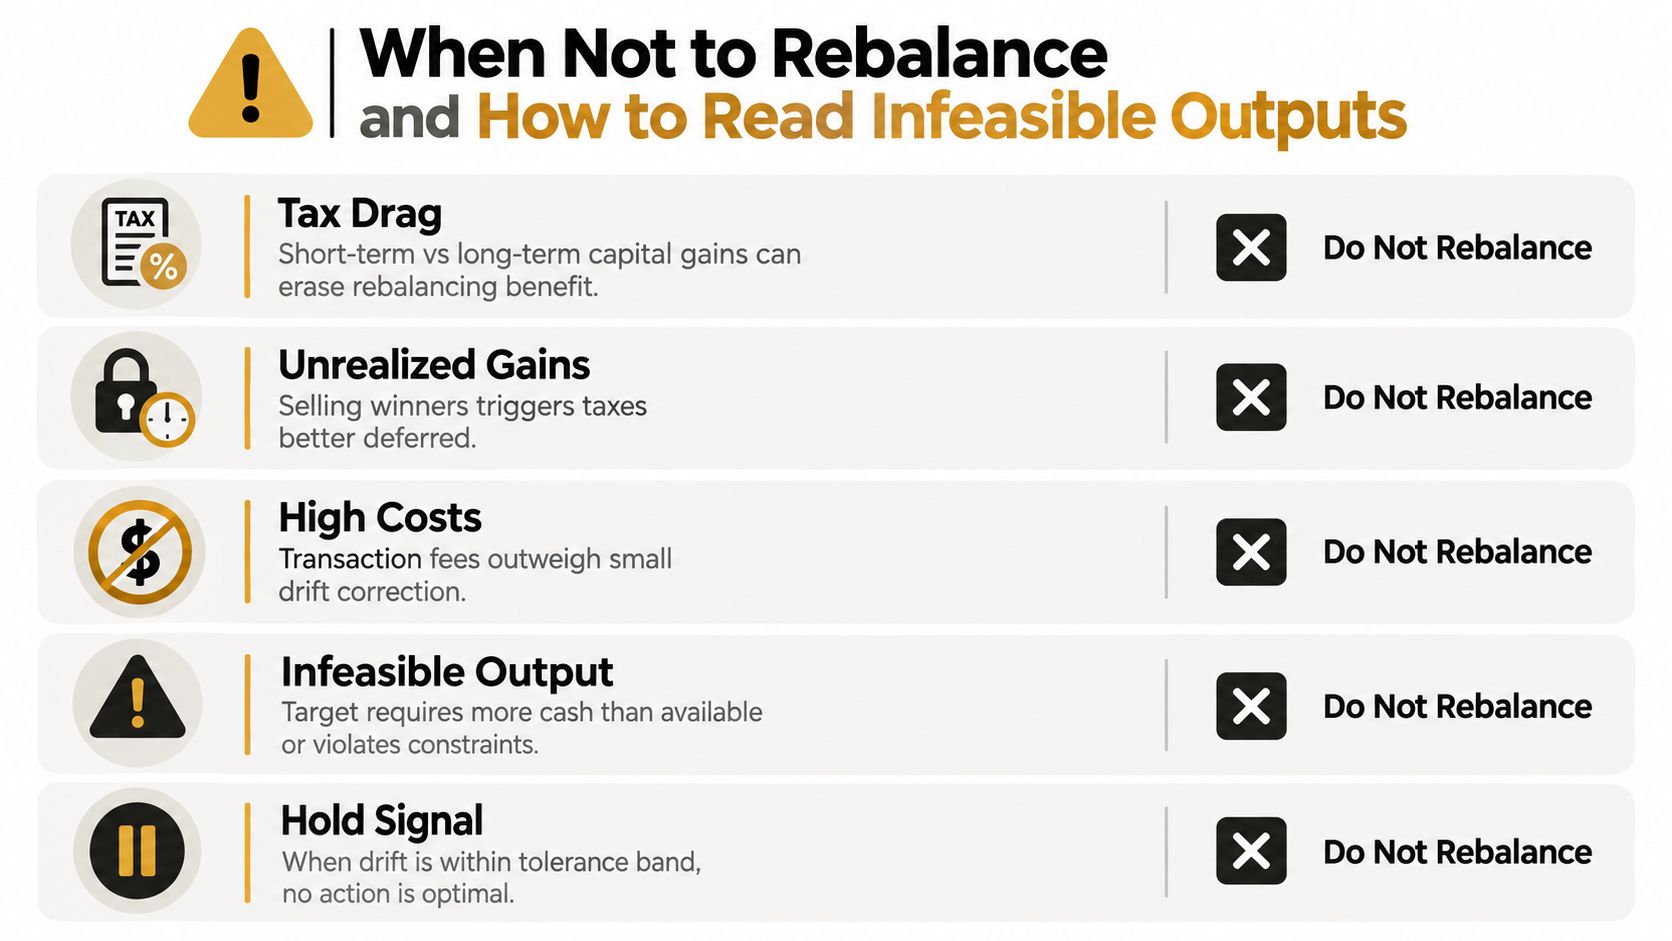
Restoring target weights can be the wrong immediate action. A calculator may identify a mathematically clean trade while ignoring the tax bill, execution cost, pending cash flow, or change in the investment plan that makes the trade unattractive.
Reasons to pause
Selling an appreciated position can create realized gains. Short-term and long-term holding periods may receive different treatment, so a tax-blind output can overstate the benefit of moving back to target. Unrealized gains can also make gradual contribution redirection preferable to immediate selling.
Trading costs matter too. Illiquid token pairs, wide spreads, gas, withdrawal charges, and minimum order rules can consume the benefit of correcting small drift. Pending deposits or withdrawals may shift the weights without any trade, which makes an immediate rebalance premature.
Your strategic allocation may also need review. If your financial goals, liquidity needs, or risk tolerance have changed, blindly restoring an old target can preserve a plan you no longer want. Change the target first, then calculate trades.
Reading infeasible outputs
Watch for these signals:
Negative available cash: The requested trades need more funding than the stated cash and permitted sales provide.
Impossible sale quantities: The tool is trying to sell more units than you hold.
Rounding failures: Fractional shares, token decimals, or minimum orders prevent exact target weights.
Tax conflicts: The chosen lots create costs or restrictions that the calculator can't satisfy.
No-action result: Drift remains inside the selected tolerance band, so waiting is the intended output.
A practical deferral rule is to pause when drift is within your band, a known cash flow is imminent, or the estimated tax and execution costs exceed the value of correcting the allocation. Re-enter the portfolio with cost-adjusted targets, updated cash, and permitted lots for a second pass. If the result remains infeasible, use a partial rebalance or contribution redirection instead of forcing an exact reset.
Quick Reference, Glossary, and Related Resources
Use this checklist whenever you configure a portfolio rebalancing calculator:
Gather holdings: Export every account and wallet, including cash and stablecoin positions.
Set targets: Confirm that the allocation reflects your current risk tolerance and goals.
Choose a method: Decide between calendar review, threshold action, and contribution redirection.
Add constraints: Enter fees, tax lots, available cash, minimum trades, and assets you can't sell.
Read the output: Separate buys, sells, cash movements, and warnings.
Validate execution: Recalculate final weights after fees, rounding, and planned flows.
Review afterward: Record what changed and update the next review date.
A risk tolerance questionnaire can help you test whether your target allocation still fits your capacity for loss and liquidity needs. An asset allocation model provides the strategic mix, while volatility drag describes how uneven returns can affect compounded portfolio growth. You should also distinguish strategic rebalancing, which maintains a long-term policy, from tactical rebalancing, which changes targets because your investment view has changed.
Term | Definition |
|---|---|
Target allocation | The intended percentage or weight for each asset |
Current weight | The asset's present value divided by portfolio value |
Drift | The difference between current weight and target weight |
Threshold band | The permitted range before the calculator signals action |
Contribution redirection | Sending new money toward an underweight position |
Tax lot | A specific purchase group with its own cost basis and holding period |
Cash drag | Cash that remains outside the intended allocation and affects portfolio weights |
Infeasible output | A requested target that can't be reached under the entered cash, tax, lot, liquidity, or rounding constraints |
Bookmark this guide after you configure your calculator. Revisit the input section when holdings or accounts change, the methods section when you revise your policy, and the infeasibility section before approving a trade list.
Yield Seeker helps stablecoin holders monitor and automate yield strategies while keeping portfolio decisions visible and under your control. Visit Yield Seeker to explore a guided approach to managing stablecoin capital alongside your broader rebalancing process.